This summer, the major project Vik and I are working on in Detroit Future City is the 139 Square Miles, an 80-page data story of the city of Detroit. During our first week in the office, all we did is manipulating different kinds of data, ranging from population to housing density, and creating charts in excel sheets given by our supervisor. Because excel work was challenging at first, I didn’t bother to think about why these data matters, how they can contribute to this document, what information these charts will communicate to the readers and who are our readers. It wasn’t until our supervisor asked us to find health data did I start to reflect on the big picture of what we’re doing and what this data story means to the Detroit community.
For the health data, we need to find the rates of diseases including cancer, asthma and diabetes in the city of Detroit, Michigan state and the US. Vik and I spent very long time googling different websites to pull together these data. It was such a difficult and tedious task that I started to wonder why we need to gather these data and who want to read these numbers. To better understand the goal of creating this data reference, we later had a conversation with our supervisor and he shared with us a lot. This report targets at a variety of audience, including large groups, non-profits, media and Detroit residents and it intends to show readers a snapchat of the progress Detroit has made so far and ongoing challenges that still exist. The ultimate goal of publishing this document is to clarify some of the misconceptions and rumors people have about the city of Detroit and to start larger conversations about problems Detroit still faces. This document will empower Detroiters with accurate numbers and help them better understand their home. This conversation is so instrumental that it informed us the full scope of the project we’re working on and kept me aware of the social mission behind this project throughout our time in DFC.
During the past six weeks, we contributed to this project in various ways. We not only collaborated on data collection and visualization, we also attended internal/external coordination meetings and learned a ton about social problems in Detroit. The most inspirational lesson that I’ve learned is that, data can be informative in their simplest way. Surrounded by buzzwords like big data, machine learning and AI, as a statistics major, I’m more inclined to digging into the complexity of numbers than understanding simple numbers, oblivious of the valuable information contained within those bare numbers. There’s no regression analysis in the 139 Square Miles, but it compiles all useful information that Detroiters care about together. It will soon be finalized and published. I can’t wait for that day.
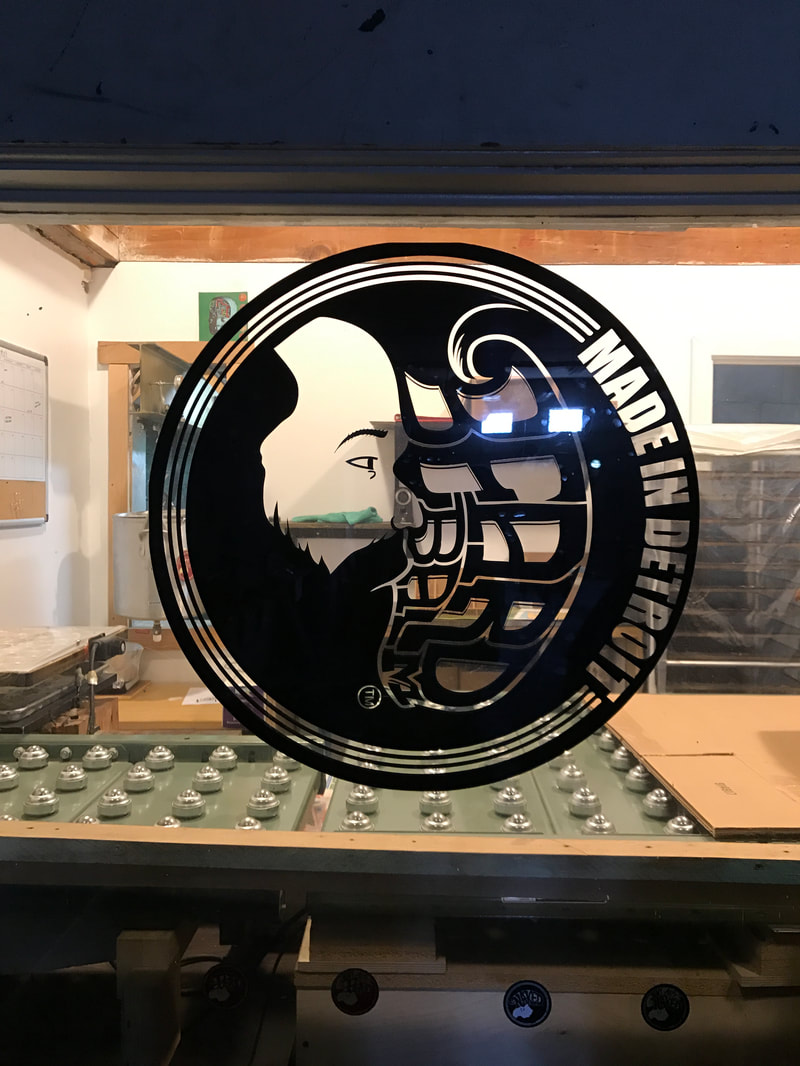
The picture below was taken in Pony Ride, but I think "Made in Detroit" is a perfect picture to describe our work: 139 Square Miles, made in Detroit.

 RSS Feed
